finance background illustration with abstract stock market information and charts over world map and stock indexes. - commodity trading stock illustrationsFinance background illustration with abstract stock market information and charts over world map and stock indexes.Graph, Chart, Business
a investor is looking at sensex and nifty through a telescope in the stock market - commodity trading stock illustrationsA investor is looking at Sensex and Nifty through a telescope in the stock marketGraph, Making Money
business candle stick graph chart of stock market investment trading, bullish point, bearish point. - commodity trading stock illustrationsBusiness candle stick graph chart of stock market investment trading, Bullish point, Bearish point.Graph, Chart, Data
automobile stock market, car sales increase and decrease - commodity trading stock illustrationsAutomobile stock market, car sales increase and decreaseCar, Data
fiscal year icons - classic line series - commodity trading stock illustrationsFiscal Year Icons - Classic Line SeriesIcon Symbol, Budget
abstract financial background - commodity trading stock illustrationsAbstract financial backgroundGraph, Chart
business analysis - thin line vector icon set. pixel perfect. editable stroke. for mobile and web. the set contains icons: analyzing, data, big data, research, examining, chart, diagram, expertise, planning, advice - commodity trading stock illustrationsBusiness Analysis - Thin line vector icon set. Pixel perfect. Editable stroke. For Mobile and Web. The set contains icons: Analyzing, Data, Big Data, Research, Examining, Chart, Diagram, Expertise, Planning, AdviceIcon Symbol, Data, Surveillance
stock market chart - commodity trading stock illustrationsStock market chartArrow Symbol, Graph, Chart
bullish market trend concept background - commodity trading stock illustrationsBullish Market Trend concept backgroundBull Market
control of business market or stock market market prices, price fluctuations, behind the scenes, economic management, huge businessman using puppets to control up and down fluctuations of the two arrows charts - commodity trading stock illustrationsControl of business market or stock market market prices, price fluctuations, behind the scenes, economic management, huge businessman using puppets to control up and down fluctuations of the two arrows chartsConsumerism
candlestick financial analysis trading chart - commodity trading stock illustrationsCandlestick Financial Analysis Trading ChartChart, Graph
green stock market rising concept - commodity trading stock illustrationsGreen Stock Market rising conceptData, Technology, Magnifying Glass
reverse and exchange icons - classic line series - commodity trading stock illustrationsReverse and Exchange Icons - Classic Line SeriesIcon Symbol, Arrow Symbol, Repetition
growth icons - classic line series - commodity trading stock illustrationsGrowth Icons - Classic Line SeriesIcon Symbol
illustration of investment or business chart on blue background - commodity trading stock illustrationsIllustration of investment or business chart on blue backgroundBackgrounds, Graph, Chart
financial city vector illustration - commodity trading stock illustrationsFinancial city vector illustrationIllustration, Business, Data
stock market graph - commodity trading stock illustrationsStock Market GraphChart, Graph, Computer Graphic
abstract financial graph with up trend line candlestick chart in stock market on blue color background - commodity trading stock illustrationsAbstract financial graph with up trend line candlestick chart in stock market on blue color backgroundChart, Graph, Backgrounds
smartphone online data analysis and management tool, data analysis mobile application - commodity trading stock illustrationsSmartphone online data analysis and management tool, data analysis mobile applicationTechnology, Isometric Projection, Digital Display
abstract financial graph with uptrend in stock market on blue colour background. abstract growing financial graph chart background. stock market increasing background. - commodity trading stock illustrationsAbstract financial graph with uptrend in stock market on blue colour background. Abstract growing financial graph chart background. Stock market increasing background.Backgrounds, Graph, Data
abstract financial background - commodity trading stock illustrationsAbstract financial backgroundGraph, Data, Abstract
investment tools line icon set. group of object. crypto, trading, dividend, bonds, gold, money, forex, funds, investment, income, wealth, saving, broker, fund management. - commodity trading stock illustrationsInvestment tools line icon set. Group of object. Crypto, trading, dividend, bonds, gold, money, forex, funds, investment, income, wealth, saving, broker, fund management.Icon Symbol, Savings
falling, the businessman fell from the arrow - commodity trading stock illustrationsFalling, the businessman fell from the arrowDeterioration, Graph, Arrow Symbol
stock market, bull market concept - commodity trading stock illustrationsStock Market, Bull market conceptChart, Making Money, Bull Market
finance and accounting icons - classic graphic series - commodity trading stock illustrationsFinance and Accounting Icons - Classic Graphic SeriesIcon Symbol, Budget, Currency
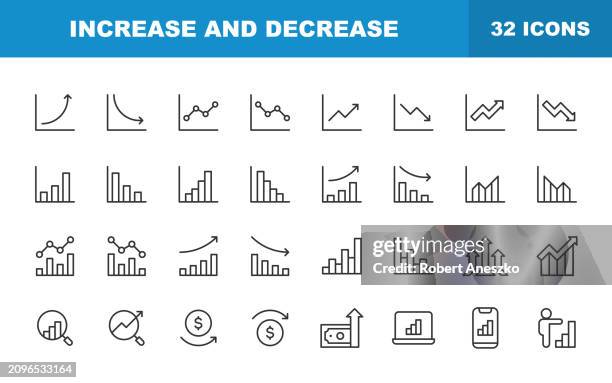
increase and decrease line icons. editable stroke, contains such icons as arrow, chart, diagram, finance, direction, graph, growth, interest rate, investment, performance, stock market, data. - commodity trading stock illustrationsIncrease and Decrease Line Icons. Editable Stroke, Contains such icons as Arrow, Chart, Diagram, Finance, Direction, Graph, Growth, Interest Rate, Investment, Performance, Stock Market, Data.Icon Symbol, Graph, Chart
data analysis line icons. editable stroke. pixel perfect. for mobile and web. contains such icons as analytics, artificial intelligence, assessment, big data, chart, cloud computing, dashboard, data analysis, diagram, finance, performance, statistics. - commodity trading stock illustrationsData Analysis Line Icons. Editable Stroke. Pixel Perfect. For Mobile and Web. Contains such icons as Analytics, Artificial Intelligence, Assessment, Big Data, Chart, Cloud Computing, Dashboard, Data Analysis, Diagram, Finance, Performance, Statistics.Icon Symbol, Data, Dashboard - Visual Aid
abstract financial graph with uptrend in stock market on blue colour background. abstract growing financial graph chart background. stock market increasing background. - commodity trading stock illustrationsAbstract financial graph with uptrend in stock market on blue colour background. Abstract growing financial graph chart background. Stock market increasing background.Backgrounds, Chart
volatility line icon with editable stroke. suitable for web page, mobile app, ui, ux and gui design. - commodity trading stock illustrationsVolatility Line Icon with Editable Stroke. Suitable for Web Page, Mobile App, UI, UX and GUI design.Icon Symbol, Editable Stroke, Line Icon
growth and finance icons - line series - commodity trading stock illustrationsGrowth and Finance Icons - Line SeriesIcon Symbol, Making Money, Currency
finance background - world map - commodity trading stock illustrationsFinance background - world mapWorld Map, Mexico
stock market chart - commodity trading stock illustrationsStock market chartArrow Symbol, Chart, Graph
stock commodity price value increase chart data - commodity trading stock illustrationsStock Commodity Price Value Increase Chart DataGraph, Chart
falling percentage sign, inflation, decrease in profits, decrease or loss of investment earnings, group of businessmen on falling percentage sign arrows - commodity trading stock illustrationsfalling percentage sign, inflation, decrease in profits, decrease or loss of investment earnings, group of businessmen on falling percentage sign arrowsMaking Money, Inflation
light arrow up on grid dark background illustration, copy space composition, digital growth concept. - commodity trading stock illustrationsLight arrow up on grid dark background illustration, copy space composition, digital growth concept.Business, Innovation, Technology
stock market candlestick financial analysis abstract - commodity trading stock illustrationsStock Market Candlestick Financial Analysis AbstractData, Graph, Chart
investment icons — monoline series - commodity trading stock illustrationsInvestment Icons — Monoline SeriesSavings, Financial Loan
business candle stick graph chart of stock market investment trading, bullish point, bearish point for business and financial concepts - commodity trading stock illustrationsBusiness candle stick graph chart of stock market investment trading, Bullish point, Bearish point for business and financial conceptsOrganisation, Risk
growth chart - commodity trading stock illustrationsGrowth ChartArrow Symbol, Three Dimensional, Graph
stock commodity cryptocurrency price value decrease recession loss - commodity trading stock illustrationsStock Commodity Cryptocurrency Price Value Decrease Recession LossGraph, Stock Market Crash, Chart
stock market increasing background illustration - commodity trading stock illustrationsStock market increasing background illustrationChart, Abstract, Backgrounds
banking line icon collection - commodity trading stock illustrationsBanking Line Icon CollectionIcon Symbol, Currency, Bank - Financial Building
stock market financial data charts - commodity trading stock illustrationsStock Market Financial Data ChartsBackgrounds, Graph
cashback icons - classic line series - commodity trading stock illustrationsCashback Icons - Classic Line SeriesIcon Symbol, Currency, Refund
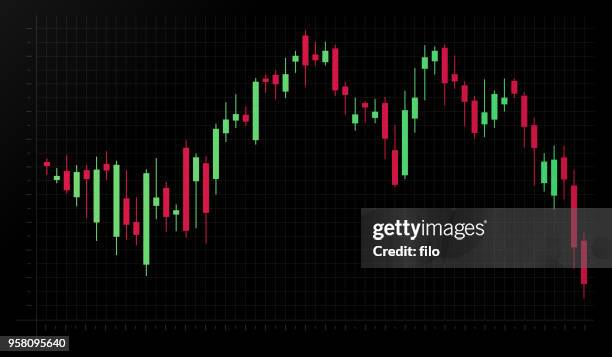
cryptocurrency stock commodity candlestick trend graph - commodity trading stock illustrationsCryptocurrency Stock Commodity Candlestick Trend GraphGraph, Trading Screen, Chart
bull market vs bear market - commodity trading stock illustrationsBull market VS Bear marketBear Market, Bull Market, Bear
red falling arrows background - commodity trading stock illustrationsRed falling arrows backgroundArrow Symbol, Red
chart and diagram line icons. editable stroke. contains such icons as big data, dashboard, bar graph, stock market exchange, infographic. - commodity trading stock illustrationsChart and Diagram Line Icons. Editable Stroke. Contains such icons as Big Data, Dashboard, Bar Graph, Stock Market Exchange, Infographic.Icon Symbol, Data, Chart
digital stock market cryptocurrency data chart info-graphic - commodity trading stock illustrationsDigital stock market Cryptocurrency data chart info-graphicChart, Graph, Data
reverse and exchange icons - classic series - commodity trading stock illustrationsReverse and Exchange Icons - Classic SeriesIcon Symbol, Arrow Symbol, Circle